


Being a good citizen in the grid, instrumentation
You can't improve what you don't measure

Our house is all electric except for our gas range: we have an HVAC heat pump, a heat pump water heater, electric washer and dryer, and EV chargers. We have solar panels, we don’t have a stationary battery, and our average monthly gas consumption is 3 therms.
Goals
We want our house to:
Be energy efficient,
Be cost efficient,
Have low GHG impact, and
Be friendly to the electrical grid.
You can’t improve what you don’t measure, so the first step is to check what data we have in place today.
Our house is located in the San Francisco Peninsula, in the PG&E territory. Some of the comments below are specific to PG&E and some are specific to California.
Smart Meters
Like the large majority of the PG&E residential customers, we have a Smart Meter.
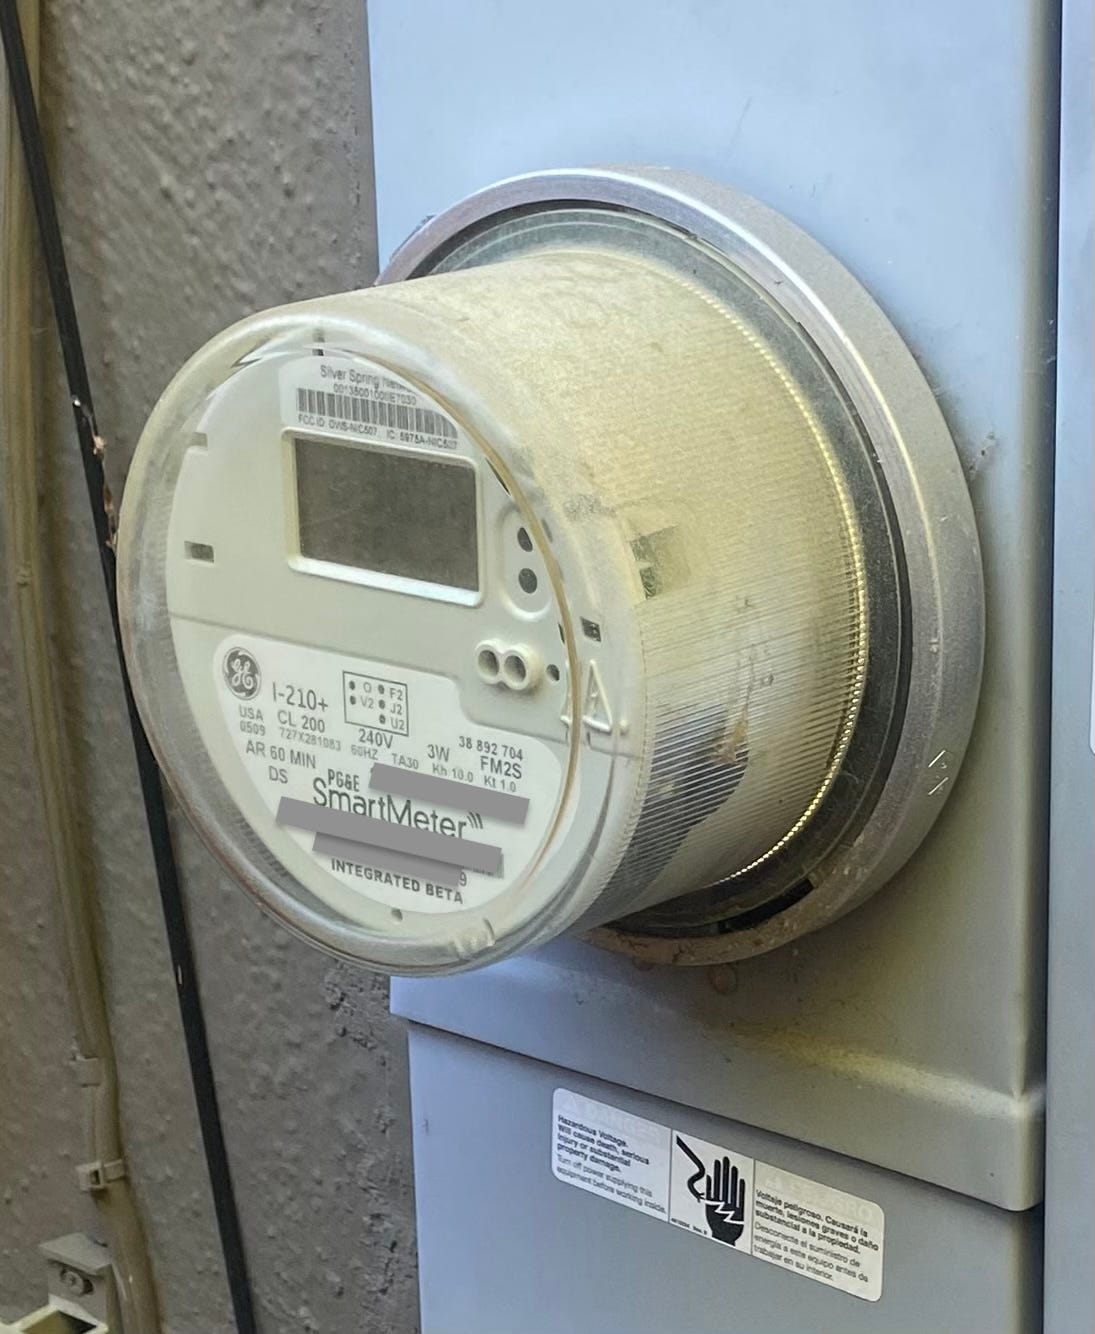
The meters are part of the Advanced Metering Infrastructure (AMI); they track imports and exports and then send the data back to the utility through a mesh network or a cellular network.
Smart Meter Data at PG&E Website
The data collected from our smart meter is available to us in the PG&E customer website through different graphs. The graph below shows imports (blue) or exports (green) per each of the last twelve months, in GWh.

This graph shows that Winter and early Spring months are net importers, while late Spring, Summer and early Fall are net exporters.
The PG&E customer website includes graphs for consumption and cost for year, monthly bill, and day views. More detailed analysis can be done after downloading CVS data in a granularity of 15 minutes using the “Green Button” feature.

Limitations
The data from the PG&E website has some limitations:
The data is not real-time, if often lags by a day or two,
The finest resolution of the graphs is only 1 hour,
The finest resolution of the CVS data is only 15 minutes,
The data is only available for the full house and it does not provide details on consumption from our electrical loads, or on production from our solar panels.
To analyze our house in more detail we needed additional instrumentation.
Emporia VUC
We have two Emporia Energy products installed in our house, a Vue Gen 3 Monitor and an Emporia Vue Utility Connect (VUC). Both products measure electricity activity and then upload the data to the Emporia backends. The Emporia backend aggregates all the data and provides graphical access to it through Mobile and Web Apps. The data can also be downloaded as CSV for more detailed analysis.
Real-Time Data
The VUC works in conjunction with a Smart Meter. The VUC connects using Zigbee to the Meter to extract “real-time” data which it then uploads to the Emporia backend. This data is then available through graphs and also as CVS downloads.
I have not tried to characterize how large is the lag between, say, turning on the kettle, and seeing the change in the Emporia app. It is not true real-time, but the events are time-stamped and the data is “good enough” (tm) to be actionable. I.e. I know it is the HVAC, or the kettle, turning on.
The VUC is small and uses <5watts. Here is a photo of our device.

Retention of Stored Data
Emporia groups all the electrical data it receives into 1 second, 1 minute, 15 minute, hour, day and year, with different retention policies.
1-second data available for 3 hours
1-minute data available for 7 days
15-minute data available for one year (only available by exporting the data)
1-hour, day, and above available for the lifetime of the device
Installation and PG&E
The VUC is very cheap ($40) and installing it does not require any electrician action, just a call to PG&E to activate the meter. PG&E includes the VUC in the list of supported HAN devices in their Device Vendor page but you may want to double-check with PG&E to confirm compatibility with the specific Smart Meter used in your house. This page has information for utilities in each state, including “supported” rates. Our rate, EV2-A, is not listed in the page and I presume there are some features that are not available to us, but the VUC does everything I want.
Using the VUC Data
I often use the VUC to confirm that our house is behaving as expected, mostly checking whether we are a net importer or a net exporter at a given time, or checking that different loads, like the EV chargers, are acting as expected. Here is the hourly activity in our house today.
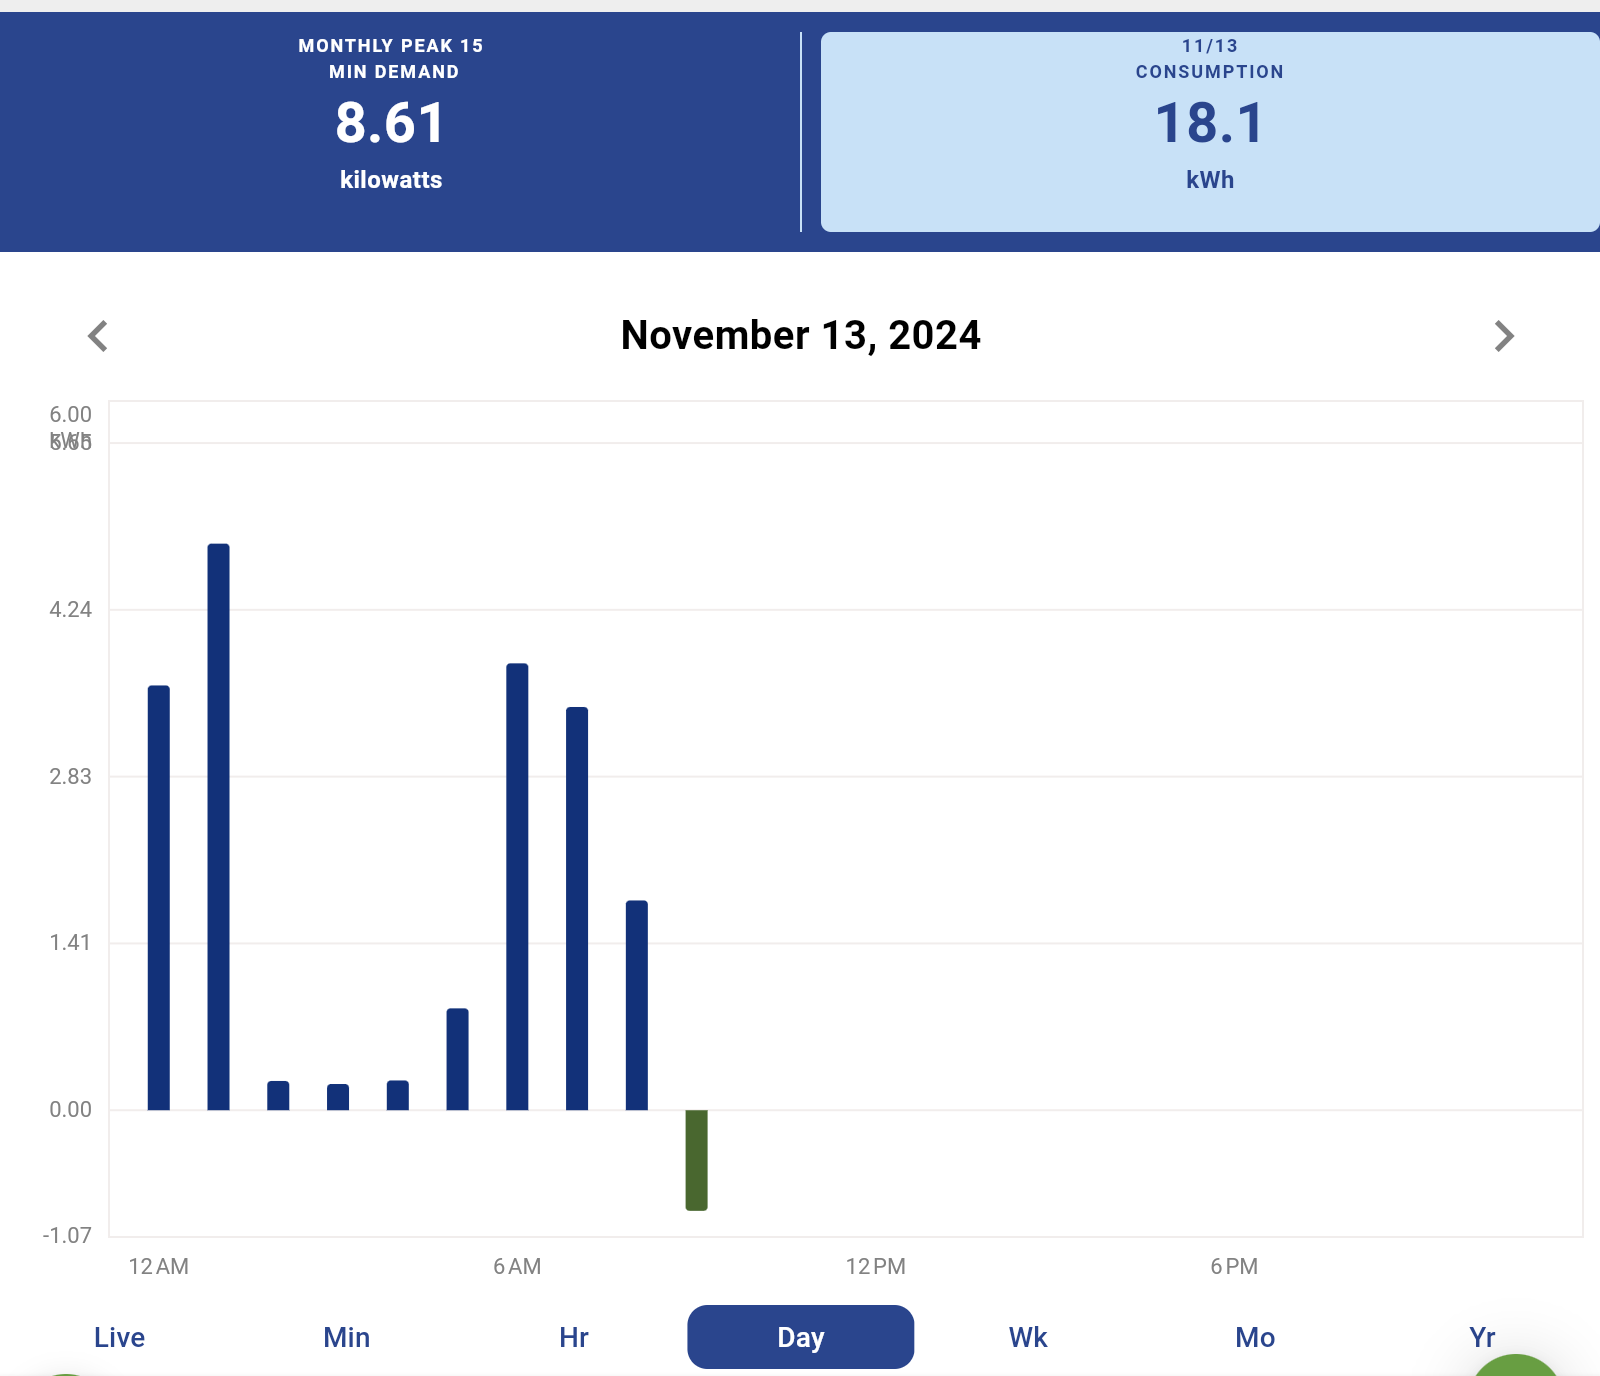
The graph shows that we imported in the early hours of the morning, to charge an EV, and then again when we woke up, to heat the house using our HVAC. By 9am we were exporting as the house was warm and our solar panels were producing.
Despite its advantages, the VUC cannot provide information on any specific load inside our house; that is where the Vue Gen 3 comes in.
Emporia Energy Monitor
A Vue Gen 3 Monitor installs on the electrical panel and measures energy as it flows through different wires using Current Transformers (CT). A typical arrangement in the US includes two large CTs for the main wires, to provide overall house consumption, and smaller CTs for each branch circuit being monitored. Like with the VUC, all data is sent to the Emporia backends.
Caveat
Installing the CTs requires operating inside the electrical panel. Below is the very good warning included in the Installation Guide for the monitor.
The Emporia Vue requires installing transformers inside a home’s electrical panel and working around dangerous voltage that could lead to injury or death. The installation should be performed by a skilled person such as a licensed electrician or other qualified professional in accordance with the regional electrical code where it is being installed.
Finding Space for the CTs
The tricky point is where to install the CTs. Here is a picture from Emporia showing an “ideal” panel with the sensors:
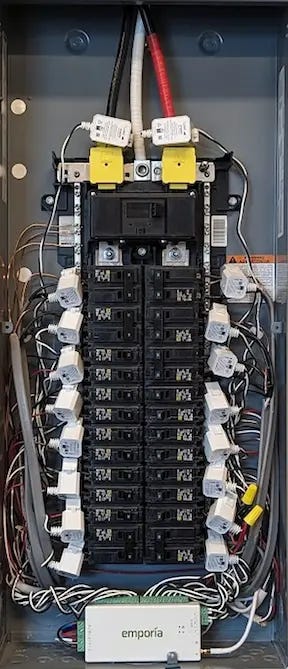
Unfortunately, the reality is not as pretty. Our electrical panel is fairly typical and it is much messier:

Getting the CT over the main conduits is particularly tricky. Emporia sells “flexible CTs” to help with this case but even with them the space is tight and cable management is difficult. That, and the local scarcity of electricians, is why I postponed adding the Emporia monitor to our panel until a few weeks ago.
Designing Away the Problem!
At some point, I finally realized that I really didn’t need to install the CT mains, and that I can get that same data from the Smart Meter using the VUC! This simplifies the problem significantly: we only need to find space in the panel for the smaller branch CTs, and only for those branches I really care about. I chose 5: the two EV chargers, the HVAC, HPWC, and the sub panel for our ADU.
Installing the Monitor
Installing the Vue Monitor requires some level of comfort with electricity. In my case I contacted several electricians before having a very good handyman, and good friend, do the work. The installation with only the branch CTs was fairly straight-forward; it also helped that we had access to the back of the panel to install the monitor and antenna there:

HVAC Consumption
As an example, below is the graph showing the HVAC consumption in November.

And here is today’s hourly data:

On Charging the EVs
The EVSE circuits tell me how much electricity we are using at a given time to charge our cars. I can use that to track the consumption, and, using the right TOU rate, how much it would cost.
Unfortunately, our EVSEs are “dumb” chargers; I can set the schedule and the level of charge from the car side, but not from the charger side. A “smart” charger that had an integration with Emporia, could be programmed to charge only when my Emporia knows we are exporting electricity. I’ll revisit this topic in a future post
Solar Production
The last missing piece of instrumentation needed is the behavior of our Solar Panels.
We have 8.8 kW of solar panels, all using Enphase microinverters, that are grid-tied. The system is connected to the Enphase backend and I get “real-time” production data for the whole system and for each panel. The panels are arranged into three arrays, facing East, South and West, and our production is evenly distributed through the day. Here is yesterday’s production, and, overlayed, that of a year ago:

And here is the year production. As expected, November, December and January are the worse months. June was very hot, and the panels had dust from nearby constructions - I later cleaned them.

True House Load - Just Math
Computing the true, internal, load/consumption of our house is pretty easy: take the net import and remove the solar production. Since we have data in 15 minutes interval, this can be done fairly accurately.
Separating EV charging from the “normal” house loads used to be a bit unreliable. Off-peak rates on EV2-A start at midnight; I’d schedule charging the cars around that time and, since pretty much nothing else was running, the time of the load helped me isolate the source of the load. This was an approximation, sometimes I also charged in the middle of the day, and now that I have the EVSE circuits instrumented I can directly track the EV charging consumption data regardless of time of EV charging.
Recap
All of this together gives me a fairly good insight on the behavior of our house and how it interacts with the grid. The solutions mentioned above are pretty cheap - a smart panel (like SPAN, or like Schneider’s Pulse) is a more complete solution but it is more expensive in hardware, and in electrician’s wages!
I think most people know about the PG&E charts, and about the downloadable CSV; but I believe most people are not aware of the Emporia VUC, which is so cheap and easy to install that I think everybody should consider doing it. Actually, Southern California Edison provides a rebate to encourage their installation; alas, PG&E does not do so.
I also find the Emporia Vue Monitor very useful. The device is fairly cheap; the main challenge is getting the CTs on your panel circuits. Having a good relationship with your electrician helps :)
Next Steps
I hope you find some of the material in this post useful.
I’ll follow-up with a post on the economics of running our house: we recently completed the true-up for our first year under NEM 2.0. After that I’ll explore the role that the house has in the larger grid.
Got to love that seasonal battery you get for (almost) free with NEM2.0 ;)
I love my Emporia Energy Monitor! Looks like the gen 3 current monitors are a little smaller.
I wasn't aware of the VUC. I guess I have no need for it with my current sensors. As for delay, I see 2-3 seconds between switching an appliance and seeing it in the graph.
Solar production varying by 3x -4x winter to summer. Interesting. Not ideal given we live in a heating dominant climate. Anyway, that's a good datapoint for when I start thinking of solar again. Just need those PG&E rates to keep going up to make the breakeven point shorter ;)