


Comparing PG&E to CCAs and POUs
A pass through the California Electricity landscape triggered by the Cal CCA Map

The California Community Choice Aggregation (CalCCA) recently released an interactive map. This post captures what I’ve learned about the California electrical system while navigating through it.
The Electric Grid in California
The Electrical Grid has been described as the world’s largest machine, and, as such, there is a fair amount of background involved. Below is a quick pass through the basic terms needed to talk about the map. If you are familiar with the concepts, you can skip through them.
Mini-History
The current landscape is the result of several historical trends.
In the early 1900s California (and the US) had a large number of small electrical companies. Over time we saw consolidation and the creation of big for-profit corporations like PG&E, but there are still many public utilities around. The late 1990s saw the deregulation of the California energy market (AB-1810, 1996), where generation was separated from distribution (and retailing), and later, in early 2000s, the emergence of Community Choice Aggregators.
Today’s landscape has many stakeholders and this will continue to evolve as we see more distributed energy resources in front of, and behind, the meter, and through Virtual Power Plants (see FERC 2222).
CCA - Community Choice Aggregation
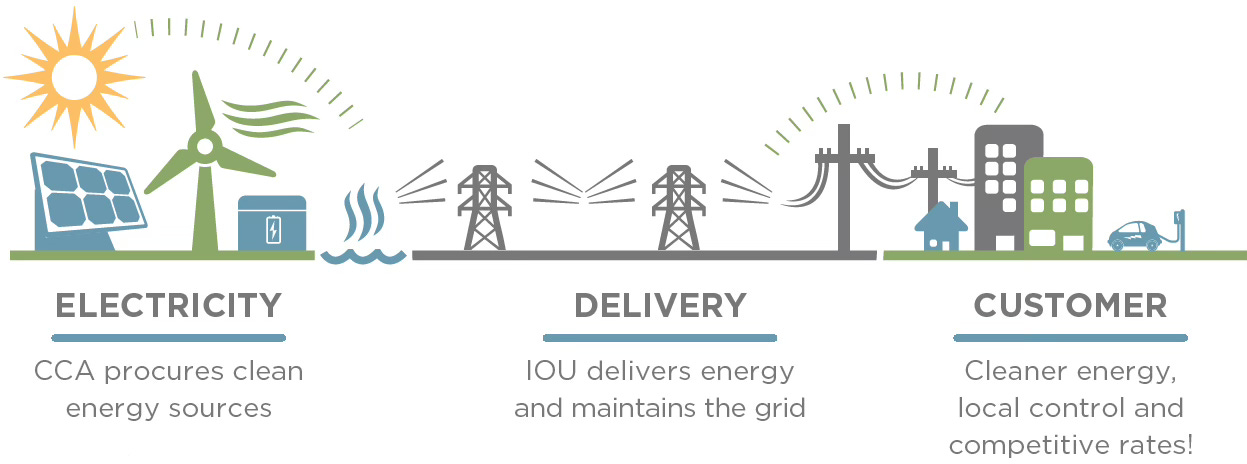
AB-117 (Midgen, 2002) created the legislation that enabled community-led non-profit Community Choice Aggregation (CCA) programs to form in California (CalCCA mini-documentary, Wikipedia). Through Community Choice Aggregation, communities can join together to pool (or aggregate) their electricity load in order to purchase clean energy and develop local projects and programs on behalf of their residents and businesses. Aggregators work in partnership with the region’s existing Investor-Owned Utility (IOU), which continues to deliver power and maintain the grid. Two or more cities or counties may participate in a CCA program as a group through a Joint Powers agency. A CCA can also be formed by a single city, such as those operated by the cities of San Francisco and San Jose.
A CCA’s main role is to aggregate power sources and provide them to the customers in their territory. The power is often from renewable sources and it is provided at a lower cost than other alternatives; also see this note.
IOU - Investor Owned Utility
California has several for-profit Investor Owned Utility (IOU) that cover much of the state. The IOUs still service most of California through their ownership of the transmission and distribution grid, the meters, and the retailer relationship.
When a customer signs for a CCA, the CCA provides generation that uses an IOU to distribute the power to the customer. The bills come from and are paid to the IOU.
POU - Publicly Owned Utilities
Publicly Owned Utilities are non-profit and, unlike CCAs, they own the distribution grid and the retail relationship with their customers.
Many of the POUs are old; check out the California Municipal Utility Association and its history.
Load Serving Entity
A Load Serving Entity (LSE) is a company or government agency that is obligated by law or via a long-term contract to provide electrical power to end-users. CCAs, IOUs, POUs are Load Serving Entities. So are Rural Coops and some other entities.
And… a load is anything that consumes electricity, like our heat pump inside our house, or a big industrial electrolyzer.
Balancing Authority
A Balancing Authority is responsible for grid balancing, which including matching production and consumption. The balancing authorities are connected by metered high-voltage tie lines and grouped into interconnections.
WECC - The Western Interconnect
The Western Interconnect is a wide-area synchronous grid. Generation and Load in the interconnect has to be balanced very closely at all times. Synchronous grids are connected to each other through high voltage DC lines.
The CCA Map
And now we can go back to the CalCCA Map!
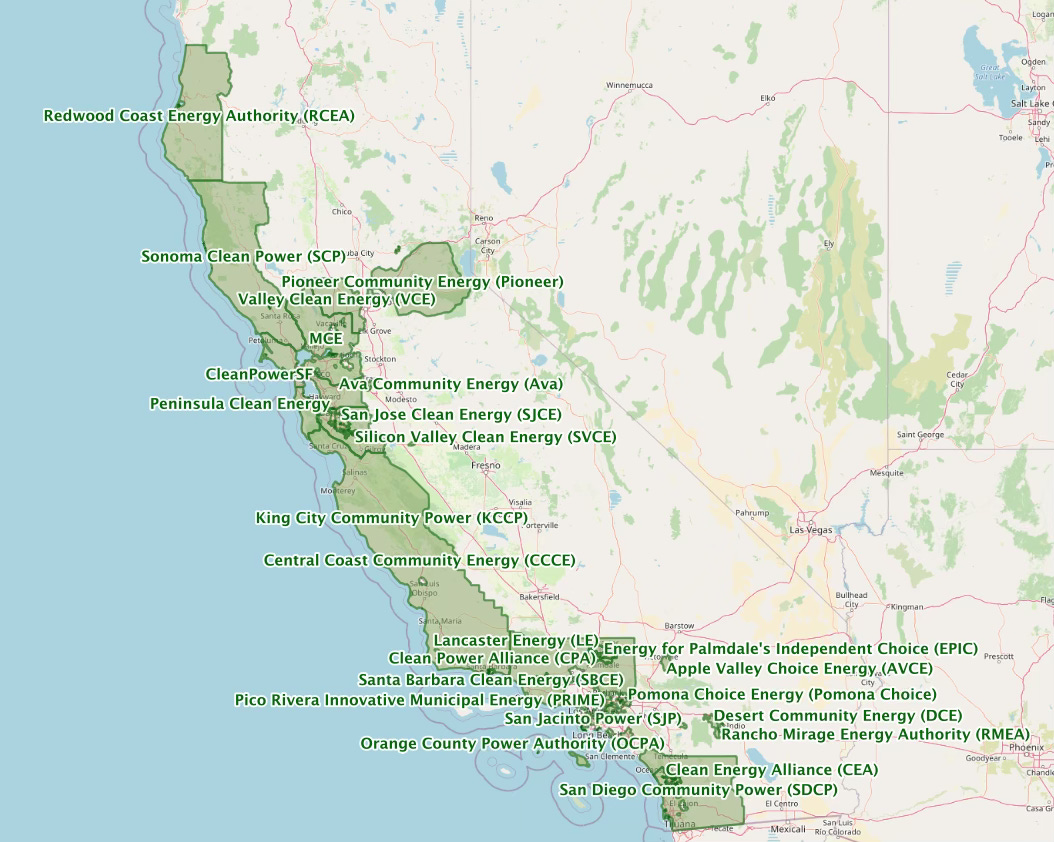
The CalCCA map shows all the CCAs in California, as well as the POUs and IOUs. The map supports navigation and search and it also includes information on the number of customers and the power from each load serving entities.
Below is a screenshot showing all the CCAs. There are 25 altogether, many more than I expected. Some are small, some are very big.
I found the map content very interesting and I started capturing details in a side spreadsheet. That ended up growing into this post…
Other Maps and Resources
I used additional data for this post including:
California Open Data project collates many sources. A search on “electricity” delivers 100 datasets; one on “electricity cca” delivers two datasets.
The California Energy Commission has multiple datasets. Here is the page on Electricity Data, and within it, a page on Load Serving Entities.
The Energy Information Administration has a plethora of data.
Consolidated Spreadsheet
I created a spreadsheet from the CalCCA map (plus this table) with data for each entity, including the type, retail sales in GWh, number of accounts, and balancing authority. The project ended being a nice expedition through California, from coastal communities to irrigation districts:
Exploring the datasets
CCAs
Here are some interesting CCAs, with sales and customer data (as of December 2023) from the CCA map:
The first CCA in California was Marin Clean Energy (MCE) which began service in May 2010. MCE has 5,624 GWh in sales and 586,296 customer accounts.
The most recent CCA to launch service is Energy for Palmdale's Independent Choice (EPIC), in October 2022. EPIC has 444 GWh of sales and 46,470 customer accounts.
Peninsula Clean Energy is the CCA for San Mateo County, where we live, and the City of Los Baños. PCE was formed on February 2016. PCE has 3,392 GWh of retail sales and 310K customer accounts.
San Jacinto Power is the CCA for the City of San Jacinto. They have sales of 172 GWh and 15,087 customer accounts
Clean Power Alliance is the CCA for 33 cities in SoCal, and the unincorporated areas of Los Angeles and Ventura Counties. CPA has sales of 10,540 GWh, and 1,006,961 accounts.
Together, the CCAs deliver 61,825 GWh to over 6 Million accounts.
POU
There are several types of POUs: city municipal departments, public utility districts, municipal utility districts, and irrigation districts.
Here are some examples of POUs:
Los Angeles Water and Power Division (LAWPD) serves the city of Los Angeles and it is the biggest POU in the nation; it has 21,062 GWh retail and 1,465,281 customer accounts. It was founded in 1902 and it started providing electricity in 1917.
Silicon Valley Power (SVP) serves the City of Santa Clara. SVP was founded in 1896 and it has 4,479 GWh retail sales, and 60,685 electric accounts.
Sacramento Municipal Utility District (SMUD) is a more recent POU. It was created in 1946, after an intense battle with PG&E. It has 10,529 GWh retail sales and 643,363 accounts.
The Turlock Irrigation District (TID) was founded in 1887 and it is the first irrigation district in California. It has 2,268 GWh and 94,839 customer accounts.
IOU Territory
The map below shows the IOUs territories. Recall that customers that choose a CCA within an IOU territory get the electricity from the CCA.

There are six IOU in California:
Pacificorp (Wikipedia, Corporate) started as Pacific Power and Light in 1910 in Oregon and Washington and later expanded into California. In 1984, it reorganized itself as PacifiCorp. Pacificorp has a very large transmission system. It delivered 800 GWh of retail sales with 2,002,779 accounts. Its territory is 6,178,184.98 Acres.
PG&E (Wikipedia, Corporate) incorporated in 1905. After large wildfires caused by its electrical lines, PG&E entered bankruptcy in 2019 and it exited it in 2020. It delivered 28,168 GWh retail sales with 2,269,282 accounts. Its territory is 42,685,909.55 Acres.
Liberty Utilities (Wikipedia, Corporate). Liberty Utilities is part of Algonquin Power & Utilities Corp. It delivered 564 GWh retail sales with 49,539 accounts, 938,671.41 Acres. Its territory is around Lake Tahoe. Unlike the others, its Balancing Authority is NVE (Nevada)
Southern California Edison (Wikipedia, Corporate). SCE also has history with Pacific Power and Light in the late 1800s and early 1900s (details). It delivered 49,598 GWh retail sales with 3,881,200 accounts. Its territory is 33,110,278.13 Acres
Bear Valley Electric Service (Wikipedia, Corporate). It delivered 131 GWh retail sales with 24,596 accounts. Bear Valley Electric’s territory is fairly limited, around the Big Bear valley in the San Bernardino Mountains.
San Diego Gas and Electric (Wikipedia, Corporate). It was founded in 1881. It delivered 5,195 GWh retail with 1,394,365 account and a territory of 2,634,141.98 Acres.
Some more Statistics
Comparing IOUs and CCAs
To compare CCAs and IOUs one should clarify what is being considered. As mentioned at the beginning of this note, the main role of CCAs is to aggregate power and make it available to consumers. CCAs do this within specific jurisdictions which are in territories served by IOUs, and these IOU deliver the energy through their distribution lines and meters, and invoice and collect from the customers.
In a very real sense, any CCA customer is also an IOU customer, but a CCA customer does not “buy” electricity from the IOU, “just” pays for the distribution of that electricity. The numbers listed under “electricity accounts” in the CCA Map, in my spreadsheet, and at the end of this section, all use a narrow interpretation of electricity account, and a CCA customer in an IOU territory is counted only in the CCA category, not in the IOU category.
In our personal case, our household purchases generated electricity from Peninsula Clean Energy but we pay through PG&E. Actually, since distribution is around 60% of the total energy bill, most of the bill goes to PG&E. Despite this, I consider myself first a PCE customer, and I have a relationship with them.
Using my spreadsheet, we can summarize as follows (caveat: POUs are undercounted as I only have data for some of them):
Delivered Electricity (GWh): IOU 84,456 | POU 55,730 | CCA 61,825
Electricity Accounts (M): IOU 9.621 | POU 2.912 | CCA 6.088
Using these two metrics, POUs + CCAs are comparable or larger than IOUs, though IOUs currently carry much larger political cloud in California.
IOU Delivered Electricity
The CEC datasets do not track delivered electricity after 2020. The CCA Map has a values for the CCAs for late 2023, and for IOUs for 2022. I do not know if the two datasets are fully comparable but there has a been a substantial transfer of electricity generation from IOUs to CCAs. Even if the shape of the curve is not fully correct, the initial and end points should be accurate since the data points in 2010 predate all CCAs and the final data points in 2023 should be the latest data.

Balancing Authorities
There are multiple balancing authorities that work within the Western Interconnect to maintain the health of the grid. I mostly knew about CAISO, but there are a few others.
CAISO - All IOUs but one Liberty Utilities, all CCAs, and most POUs use CAISO.
NVE - Liberty Utilities uses the Nevada Energy as its Balancing Authority.
LAWPD - Several POUs in the LA area use LAWPD as their Balancing Authority.
BANC - This is a Joint Powers Authority (JPA) Balancing Authority; it is the third largest Balancing Authority in California! SMUD and several Irrigation Districts use it.
The Largest
IOU with the most accounts? SCE, with 3,881,200
POU with the most accounts? LAWPD, with 1,465,281
CCA with the most accounts? CPA, with 1,006,961
More Posts… Later
I learned a lot writing this post. I hope to continue to write more content in the future, as I learn more. In the meantime, look at the data in the spreadsheet and poke from there.
That's great post Eduardo. Just one thing I might reword:
"The CCAs deliver generation power for specific markets while the IOUs have very large territories, handle distribution within those territories, and also handle billing for CCAs customers."
I'd phrase it like this
"The CCAs operate within a territory of an IOU. They enter into Power Purchase Agreements (PPA) to acquire generation power which they sell to their customers, generally at a price lower than the IOU would charge. This power is delivered over transmission and distribution grids owned and managed by the IOU. The IOU still handles the billing but now the bill is separated into a delivery charge from the IOU and a charge for the electricity from the CCA."
It's a subtle change but more emphasis that the IOU owns the distribution grid and does the delivery (not the CCA ) where as a POU owns the distribution grid (at least that's the case for Palo Alto which would be worth adding to your list). If there are examples where I'm wrong, please let me know!