


NEM 3.0 visits our home
An experiment plugging NEM 3.0 export rates into our household

I just ran an experiment where I plugged in the NEM 3.0 export rates into our NEM 2.0 California household. I already knew that NEM 3.0 would generate lower export values but the magnitude of the difference was surprising.
The house
We live in a modest-sized house with reasonable insulation in a mild climate (SF Bay Area). We are an almost all-electric household: heat pump space heating/cooling, heat pump water heater, electric dryer, two EV vehicles. Our only methane gas appliance is a legacy stove (~3 therms/month). We mostly charge our EVs at home.
Data and Spreadsheets
I have been tracking our consumption for years, mostly through the PG&E data but also using an Emporia Vue Utility Connect, and I capture the data into spreadsheets.
We installed solar panels late Aug ‘23 and I started capturing the production data from our Enphase system then. I also added PVWatts estimates for months in early 2023.
Estimates and Bills
After all this, I track PV production, internal consumption, and net consumption. I can also compute estimates for the costs using the appropriate rate formulas, which, a bit surprisingly, are pretty close to the PG&E bills.
I will write down a full report when I have a full year of production from our panels in the Fall, but, in the meantime, I wanted to understand better how NEM 3.0 works, so I decided to plugin its export rates into my spreadsheets.
Delivery and Generation
The bulk of our electric bill in California is volumetric; i.e. the cost depends on the amount of energy transacted at the meter and tracked using smart meters. The rate usually varies during the day and through the year.
At any given time, the rate has a generation component, intended to capture the cost of generating the electricity, and a delivery component, to capture transmission, distribution, and everything else.
CCA and IOUs
California adopted Community Choice Aggregation (CCA) in 2002 and CCAs currently serve over 14M customers. CCAs interact with Investor Owned Utilities (IOUs): the CCA aggregates power sources and have control on the generation part of our bills, while the IOU handles billing and delivery under regulation by the California Public Utilities Commission (CPUC). Our local CCA is Peninsula Clean Energy (PCE); our local IOU is PG&E.
California also has municipal utilities. A municipal utility, like Sacramento Municipal Utility District (SMUD) or the LADWP, controls generation, delivery and retailing, and they have more flexibility than controlling the retail prices that their customers experience.
NEM 2.0 vs NEM 3.0
In late December 2023 the CPUC adopted a new export tariff for IOU territories. The old tariff (NEM 2.0) compensated generation exports at the retail rate; the new tariff (its formal name is NBT but most people call it NEM 3.0) uses an export formula based on Avoided Cost Calculator (ACC). Relying on ACC was very polemic, and continues to be so.
Although our Solar Panels are under the older NEM 2.0 tariff, I can plug in the new formulas into our actual consumption and production to learn more about NEM 3.0.
NEM 3.0 Rates
The PG&E Energy Export Credit Rates (EEC Rates) are available from their website. The rate table assigns two export rates to each hour of the year: one for the delivery component and one for the generation component. The hours are grouped by month and are different for weekdays and weekends. Below is the table for 2024.
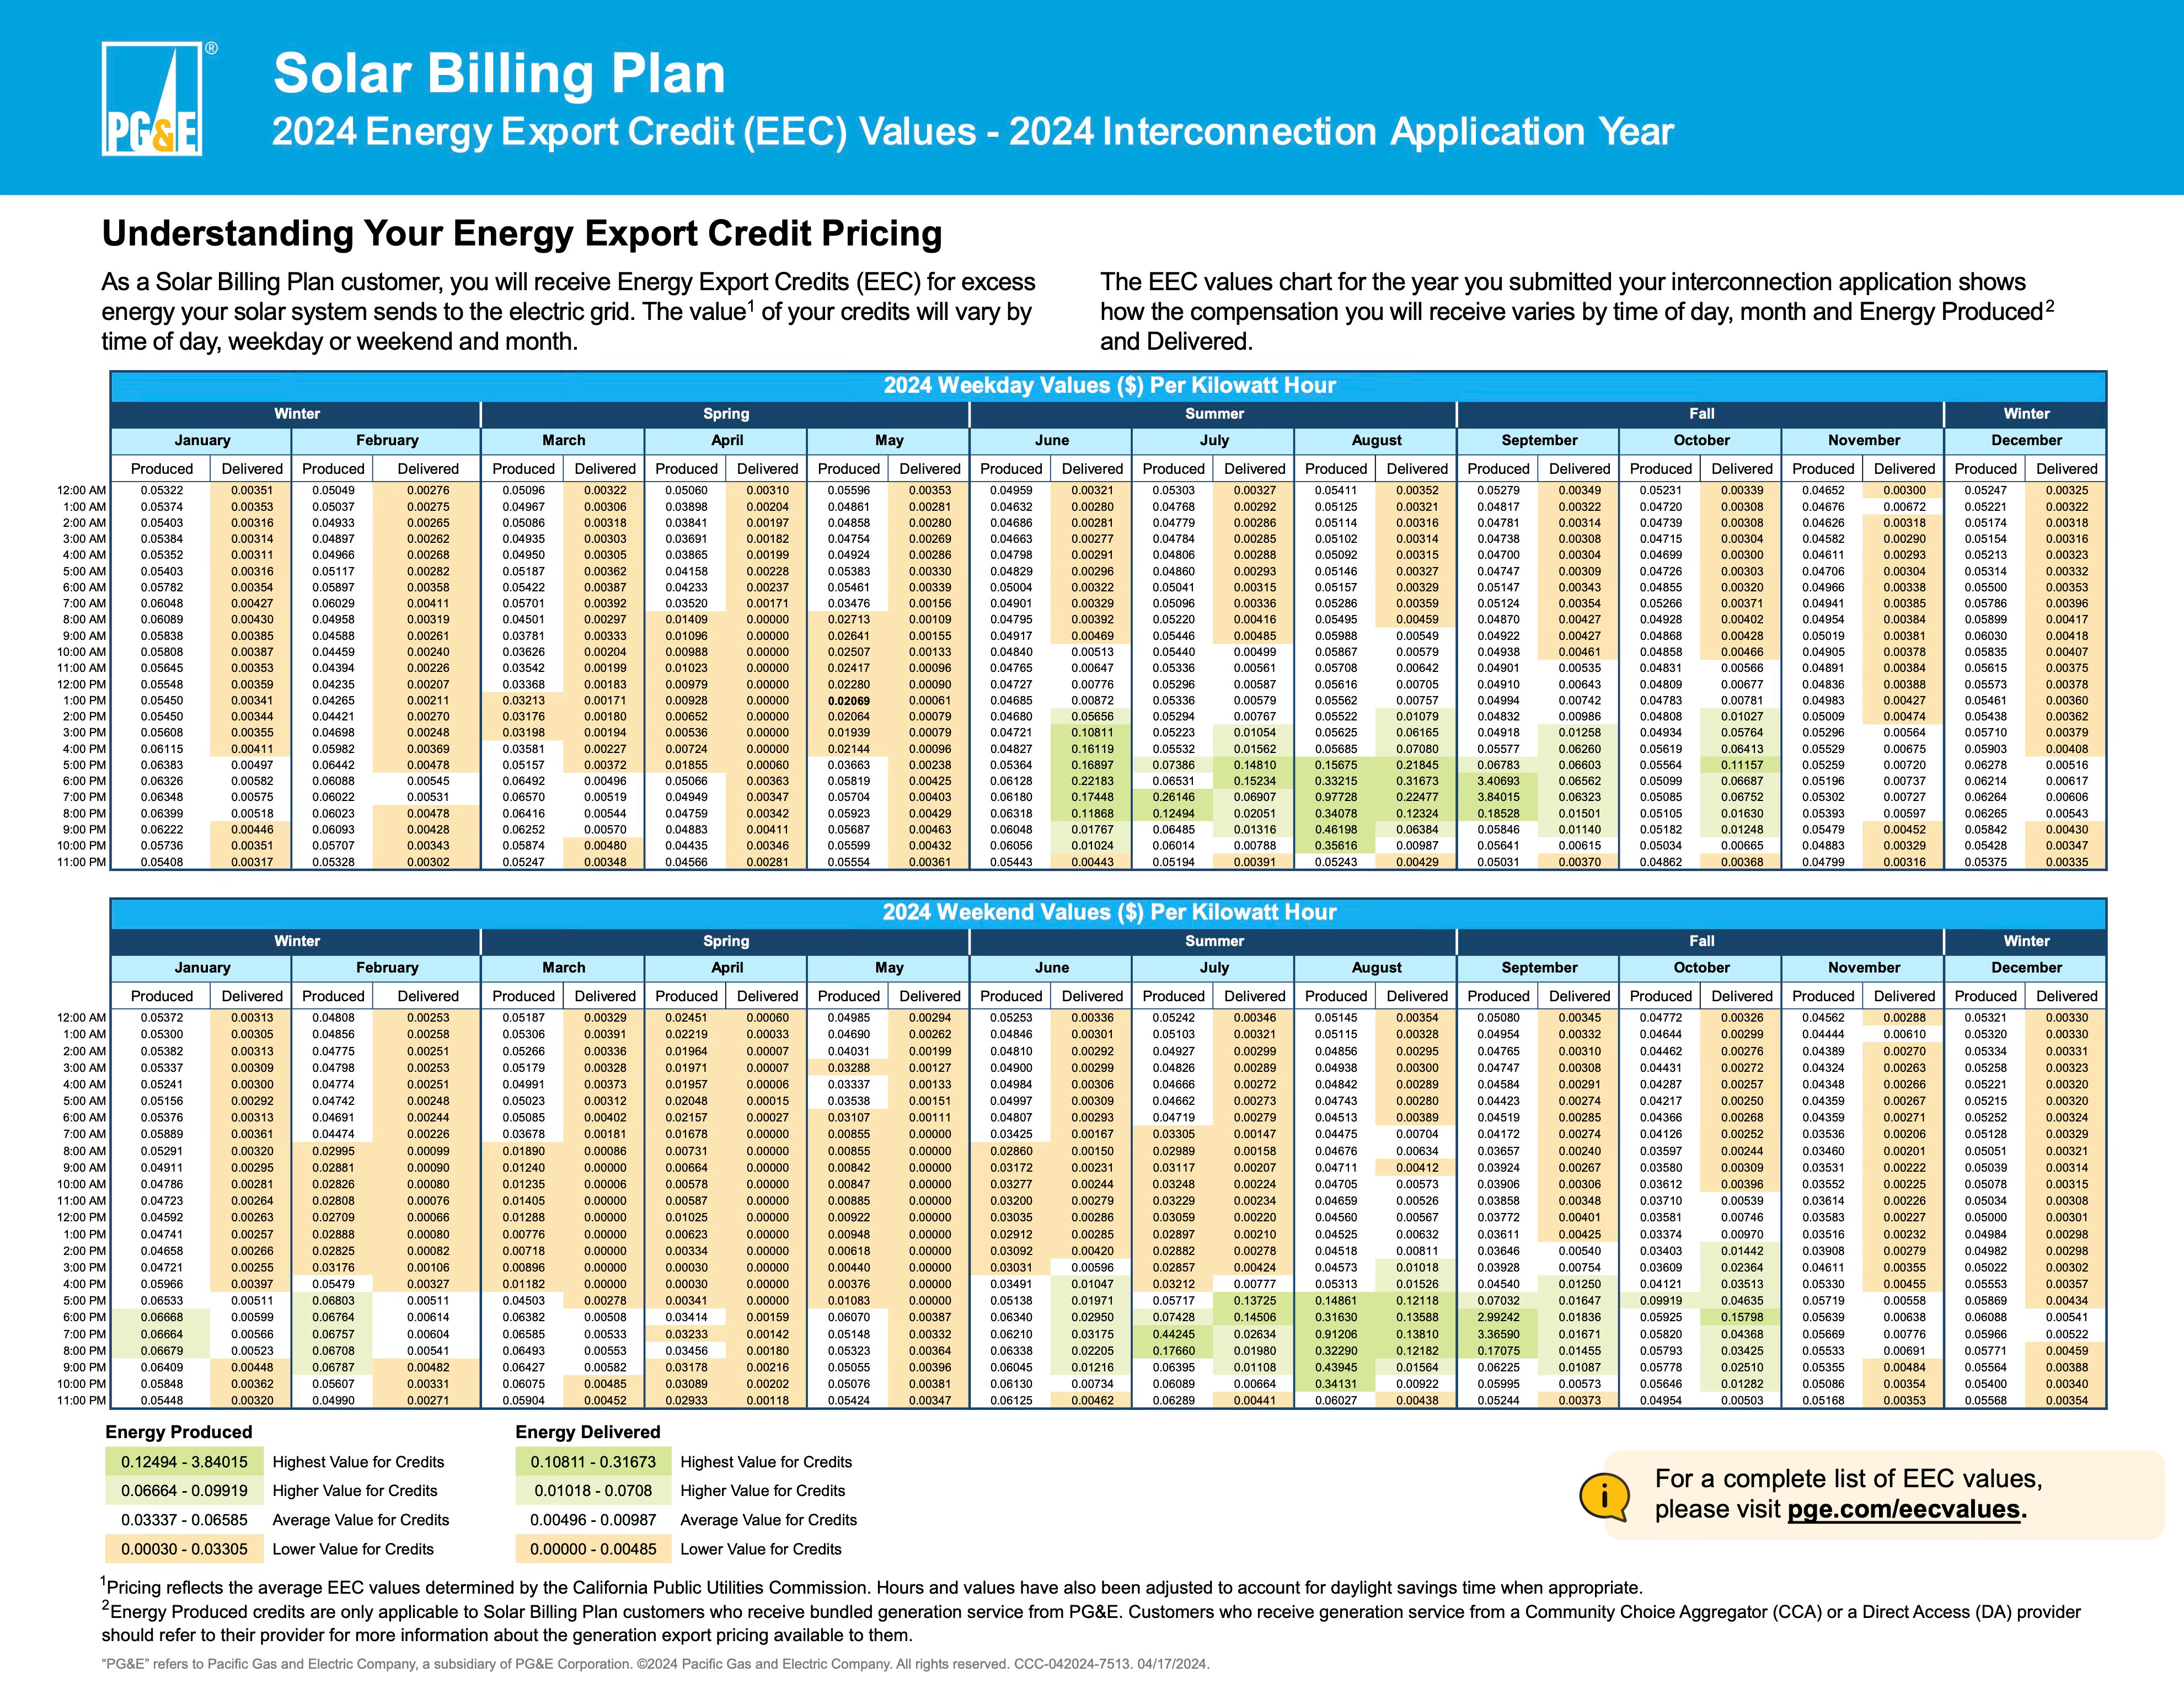
PG&E also publishes a complete list of EEC values as a CSV spreadsheet. If you download it you will see that there are 350K rows! That is because there are rates for generation and delivery, for each month, for weekends and weekdays, for each hour, and then, the rates are shown for multiple years into the future.
If you want to use the rates for 2024, use the above table, or you can use the spreadsheet I extracted HERE.
Running the new estimates
After collecting all this, I reorganized my spreadsheets and formulas and then I computed all export credits under the different rates. The result is below:
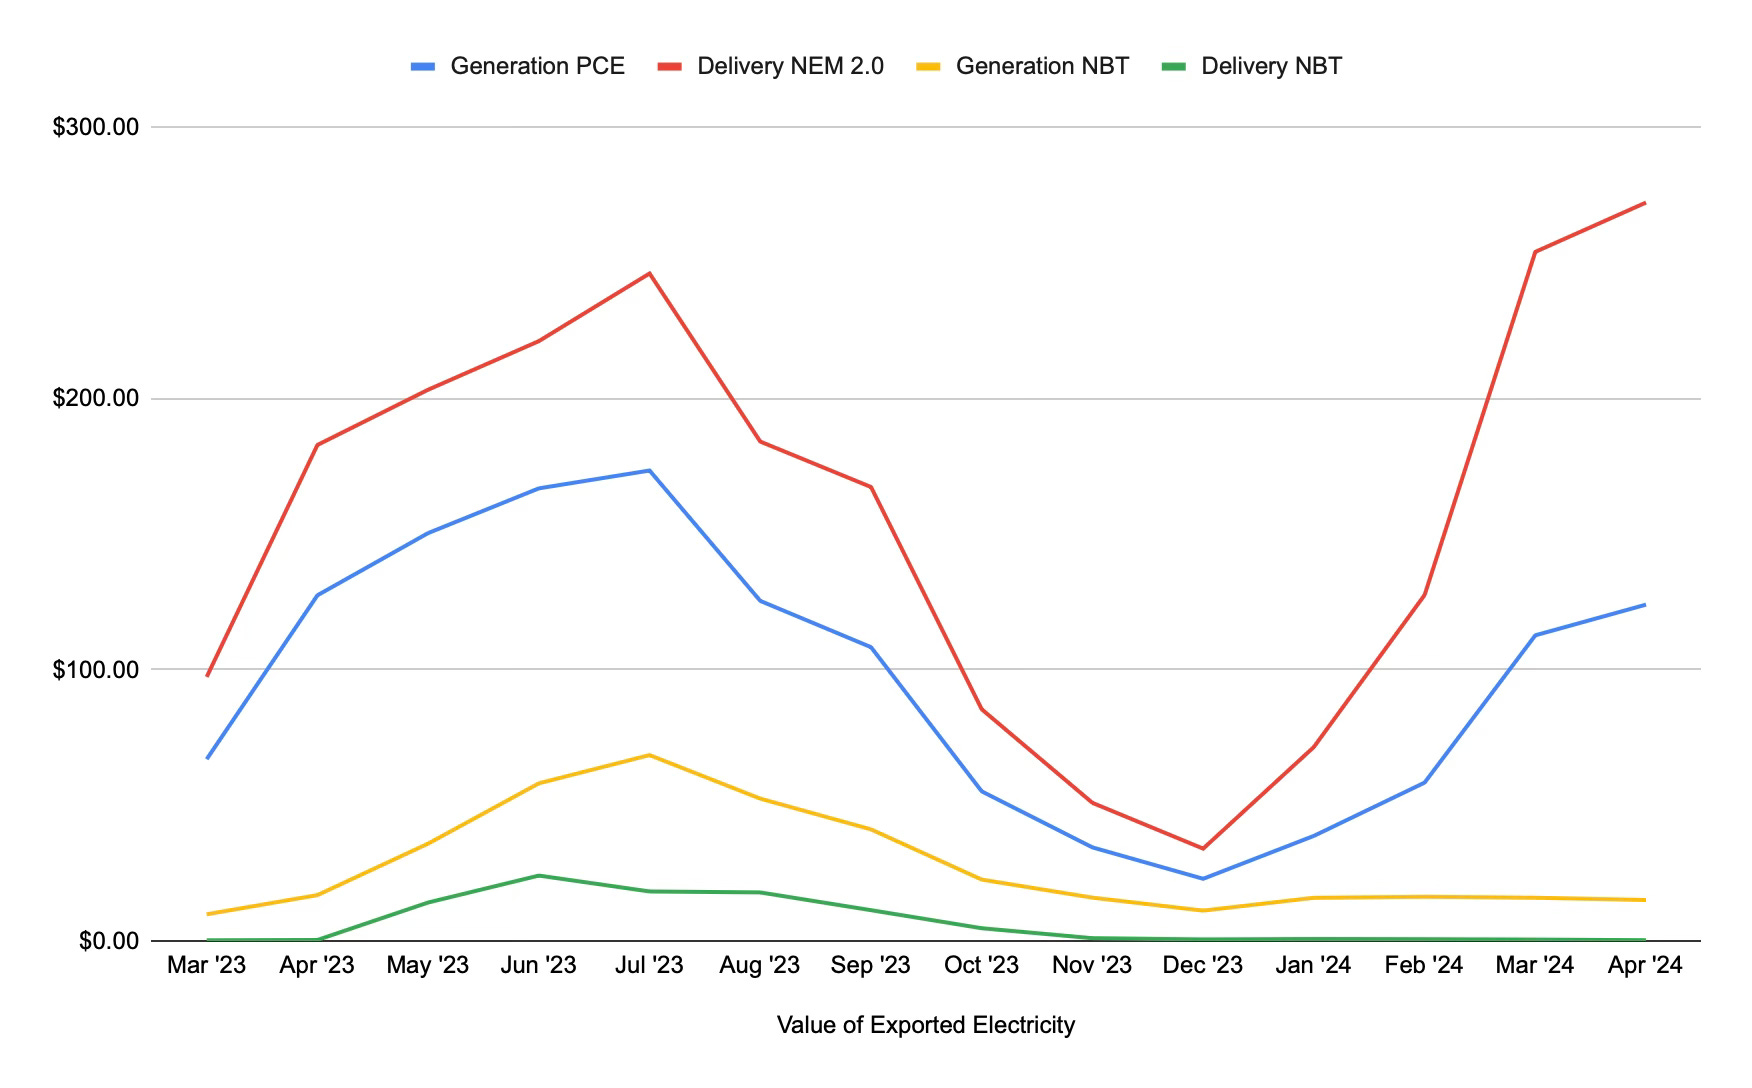
Some comments:
The chart above just shows export credits, not net values. Our consumption includes charging our EVs at home.
PG&E’s high rates means Solar Panels also have a substantial economic contribution by reducing imports that is not shown in the charts above.
Data points in the graph before Oct ‘23 are based on the solar production estimated by PVWatts.
The graphs above do not attempt to track the “true-up” process, when annual credits are readjusted. The PCE process is different, and more generous, than the PG&E process.
Under NEM 2.0 and as a PCE customer, we get the export credit for the top two lines: Generation PCE (blue) and Delivery NEM 2.0 (red).
If we were under NEM 3.0 and a PCE customer, we would get credit for Generation PCE (blue) and Delivery NBT (green).
If we were under NEM 3.0 and were not using PCE for generation, we would only get credit for Generation NBT (yellow) and Delivery NBT (green).
The original proposal for EEC was based on ACC and ACC varies depending on the climate region. My understanding is that the current EEC is ACC averaged over all the regions.
Initial Reflections
When I first plugged in the NEM 3.0 formulas I was surprised by how low the export credit was. Checking the entries in the tables shows why: many values are zero or very close to zero. That is true for delivery but generation is only a bit better. There are many ongoing arguments on why ACC is a poor way to estimate the true value of distributed solar; I like the study commissioned by the Sierra Club and submitted to the Idaho Public Utilities Commission.
All PCE customers, including those under NEM 3.0, get the export generation credit from PCE. The PCE credit can be used to pay for PCE generation bill but anything left at the end of the year (April) is returned to the customer - this is a better program that PG&Es and PCE does this while running a good business and reinvesting in the community.
If we were under NEM 3.0 we would change our consumption pattern, most notably we would charge our EVs during the day prioritizing surplus from our panels. I may attempt to estimate this in a future exercise.
Batteries would further reduce our imports. The price of batteries keeps going down, the permitting and installation processes are improving, the vendor offerings are improving, and PCE, the California Energy Commission, and others encourage adding residential batteries. I am planning to run a simulation in the Fall and I’ll report then; hopefully we will install batteries in 2025.
Parting Thoughts
Thanks to the generation export credit from PCE there is still significant value in Solar Panels, even under NEM 3.0. Some care with our electrical loads (EV charging) will make a difference, and adding stationary batteries would help further.
I hope the CPUC revisits the value of behind the meter solar. I have an opinion but I do believe ACC/EEC is not accurately assessing the value of solar. The CPUC should do a proper assessment of how the programs are working, what is the total benefit of solar, and adjust to a rapidly changing grid.
Ah… and thanks to our CCAs, starting with Peninsula Clean Energy.