Summary
A household using Dynamic Rates follows a basic strategy: import electricity when it is cheap and conserve - or export - when it is expensive. This means that the potential benefits of these rates depend on their shape and magnitude. If the rates were very flat there would be little benefit in modifying the demand. Conversely, if the rates had large and unwieldy spikes, a household would have to be very careful to avoid financial risks.
The rates that the PG&E Hourly Flex Pilot have assigned to our household in the last 14 months are low with occasional 1-3 hour spikes that can be managed through a time-shifting battery system. Interestingly, the sample Dynamic Rates provided by PG&E from earlier periods in 2023 have a significantly different profile suggesting improvements on the CAISO grid which may have implications for tariffs designed around Dynamic Rates.
Related posts
You may also be interested in these posts:
Variability of Electric Rates
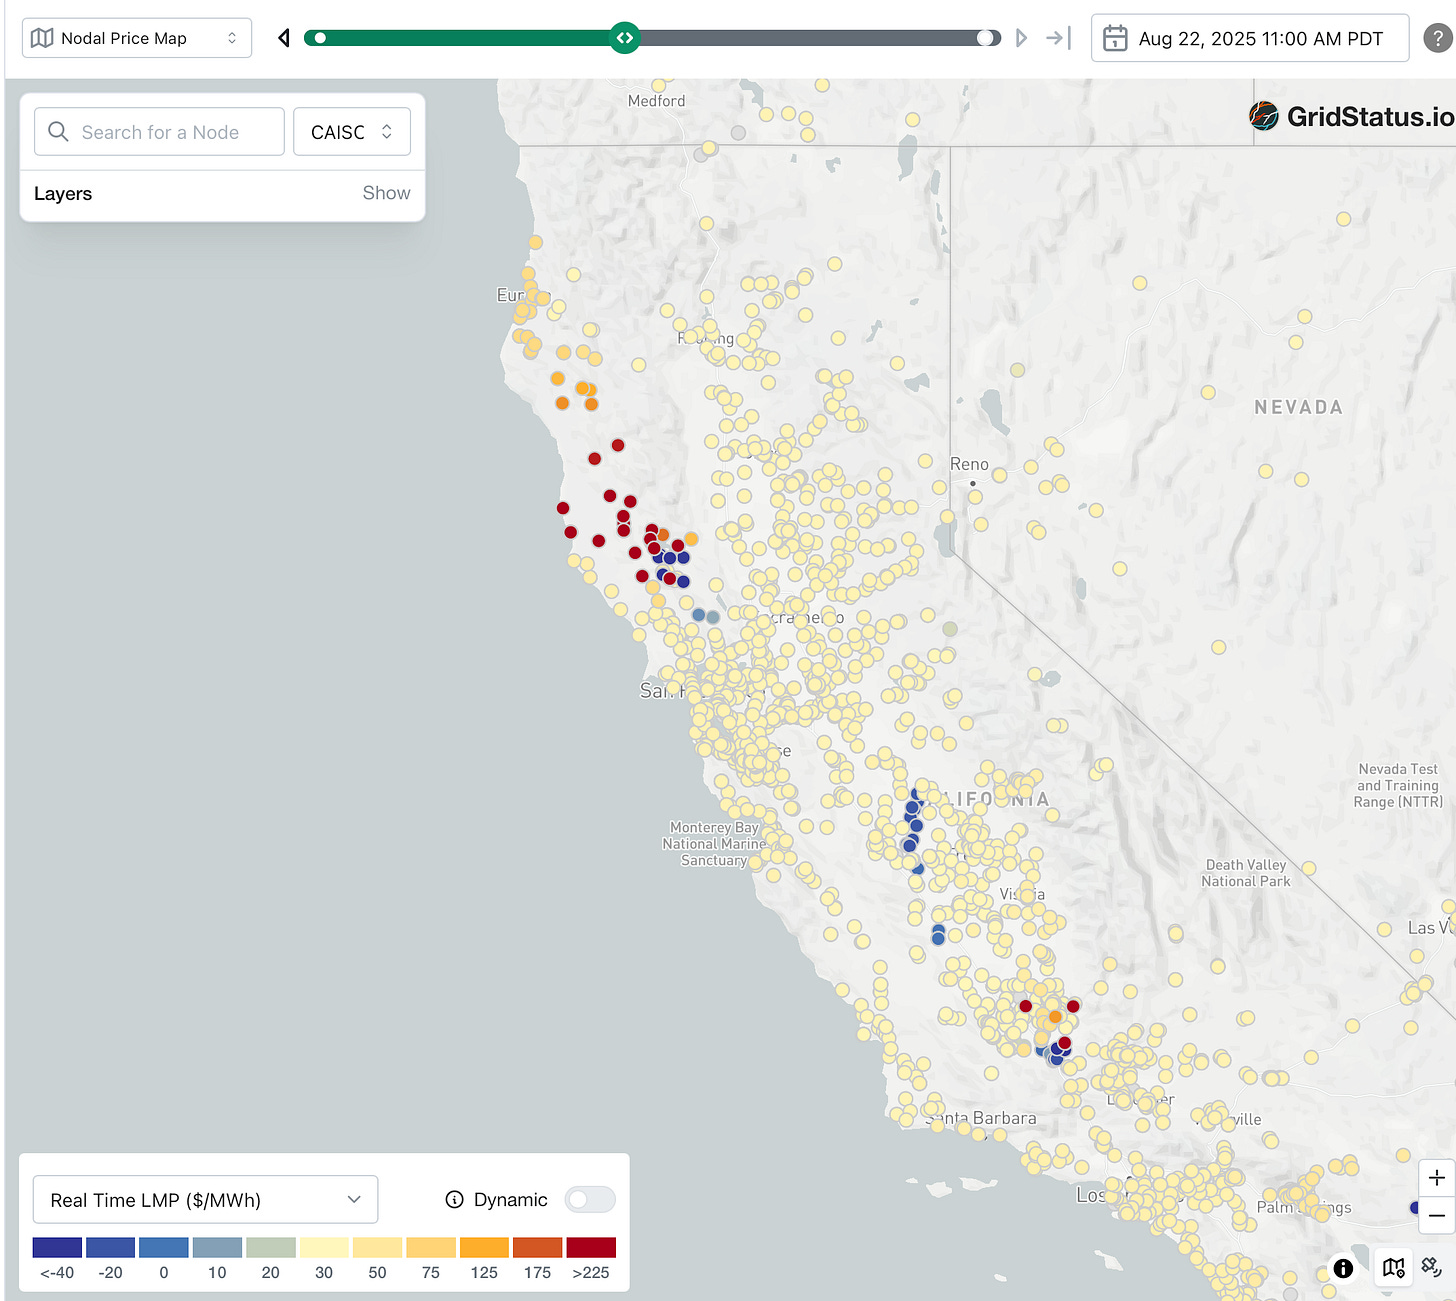
The cost of generating and delivering electricity to a Grid Connection Point (GCP) depends on its location and the time of day. I show this through examples using screenshots of a map that depicts the Locational Marginal Price (LMP) at pricing nodes (p-nodes) in the California Grid.
The screenshots are from GridStatus and the data is from CAISO. LMP is the additional cost to produce one more unit of electricity at a specific moment in time (see the full definition). The map shows all the p-nodes in the grid; if you want to see the transmission lines connecting them, check the Full Network Model. Each node is colored according to its corresponding LMP value and the map shows more details when a node is selected. The map allows to select a specific date and time; the screenshots are from 11 am on Friday August 22nd, 2025.
Variation by Location
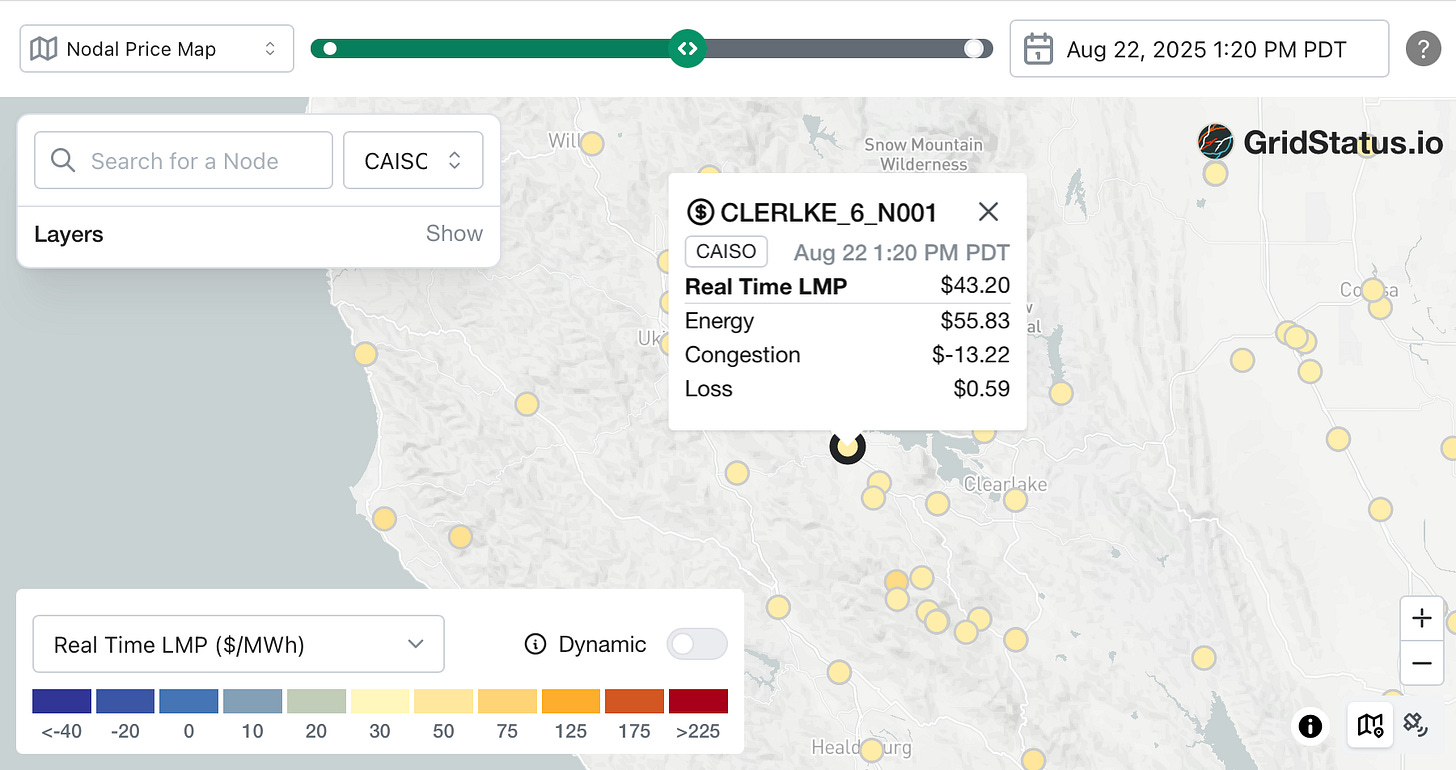
At the selected time, the LMP value at most p-nodes was about 3 cents/kWh (or $35/MWh) with some exceptions that show in the map as red and blue nodes. I’ll use two p-nodes around Clear Lake as examples.
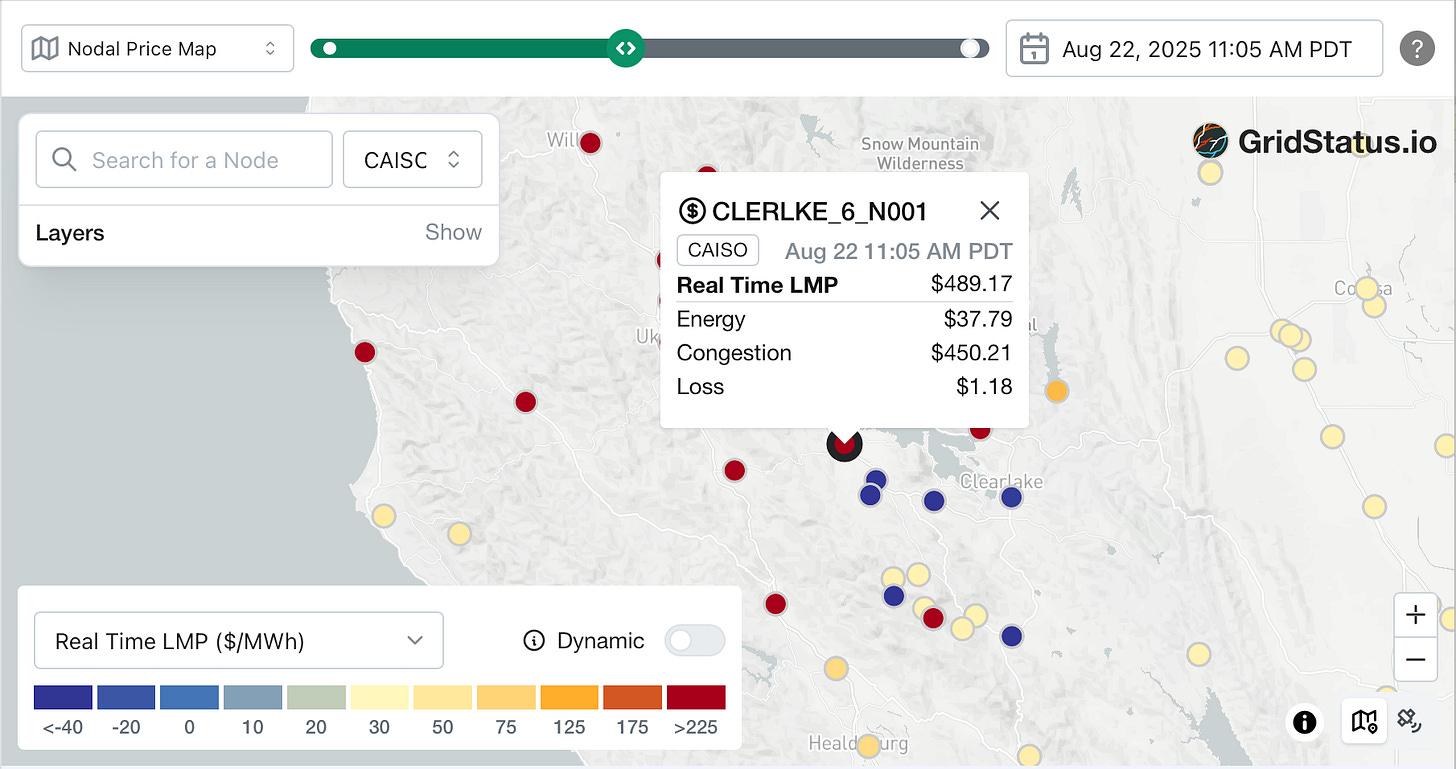
CLERLKE_6_N001 is on the southwest shore of the lake. Although the generation value is just $37/MWh (3.7c/kWh) the node has a large congestion value at that time, for a total of $489.17/MWh.
At that same time and very close by, the HOMEGRND_1_N001 p-node exhibited the opposite behavior: it had the same energy cost but it had a strong negative congestion value, $-77.50, for a total of $-41.27/MWh
Variation by Time
The price changes not just in location but also in time. Just a bit later, the same CLERLKE_6_N001 p-node mentioned above showed a negative congestion value:
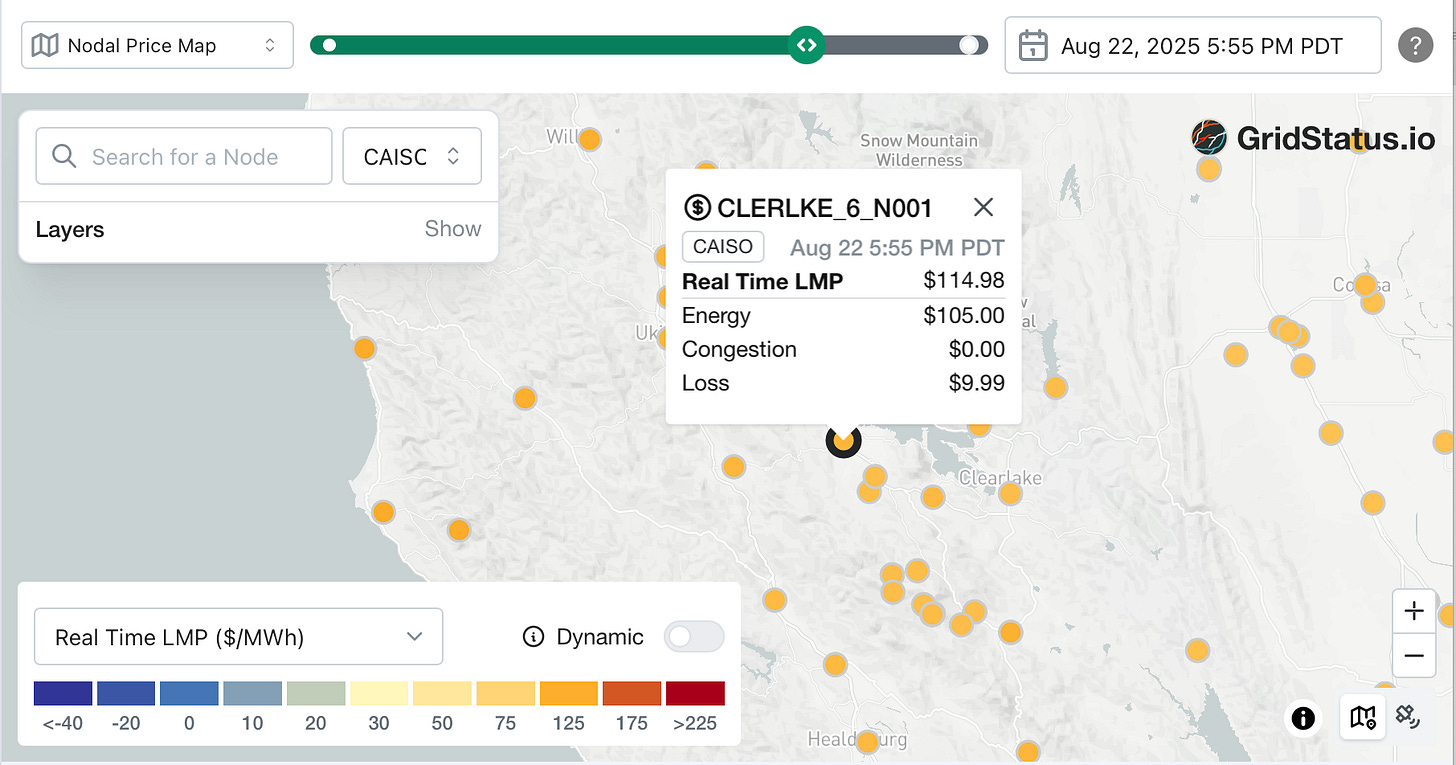
In these examples the biggest variable is Congestion, but the generation cost also varies. Later in the same afternoon, the generation cost for CLERLKE_6_N001 p-node was double that of earlier in the day; congestion, though, was zero:
This variability in location and time is the basis for dynamic rates.
Dynamic Rates
Dynamic rates are designed to capture the total cost of generating and delivering electricity to a given GCP, including distribution congestion. The intention is to provide a signal to discourage importing energy when it is expensive and to encourage imports when it is cheap. And, conversely, to encourage exports when the grid needs it, and discourage exports when it does not: when the rate is negative, an energy provider will pay to export energy!
Dynamic Rates were promised in California decades ago. SCE ran a pilot between 2022 and 2024 that had minimal participation; that pilot has been extended recently. In this post I report on the ongoing PG&E pilot.
The CPUC oversees the pilots. I plan to write another post on the bigger picture of the pilots and on tariffs. Here I just report on the data.
The PG&E Hourly Flex Pilot
The time granularity for the PG&E pilot is 1 hour, and the location granularity is at the distribution circuit level. I did not join the pilot originally because it did not allow NEM customers at the time but I have been collecting the rates applicable to my circuit since June 2024.
Circuits
If you are curious about the distribution grid in your area, check out the PG&E’s GRIP (Grid Resource Integration Portal)
The Rate Formula
The rate value used in the pilot is the addition of the following:
CLD: Customer Load Distribution – hourly distribution cost component
MEC: Marginal Energy Cost — real-time energy price from wholesale markets
MGCC: Marginal Generation Capacity Cost — cost allocated for providing generation capacity during peak demand
I am not technical enough to understand the details of this - I am taking the validity of the formula as a given.
This value does not include any fixed infrastructure costs; things like wildfire abatement, or transformer replacement, or many more. Today, these charges are blended into the volumetric rates (like EV2-A) but starting in March 2026, most of these fixed costs will come from a new, non-bypassable, Base Services Charge ($24.15). More on that in a future post.
Added: My spreadsheet only includes the final hourly rate and I had not realized that the CLD can be quite high in some cases. I will publish an update when I get the full information for my circuit through the API and I can look at it.
Rates since June 2024
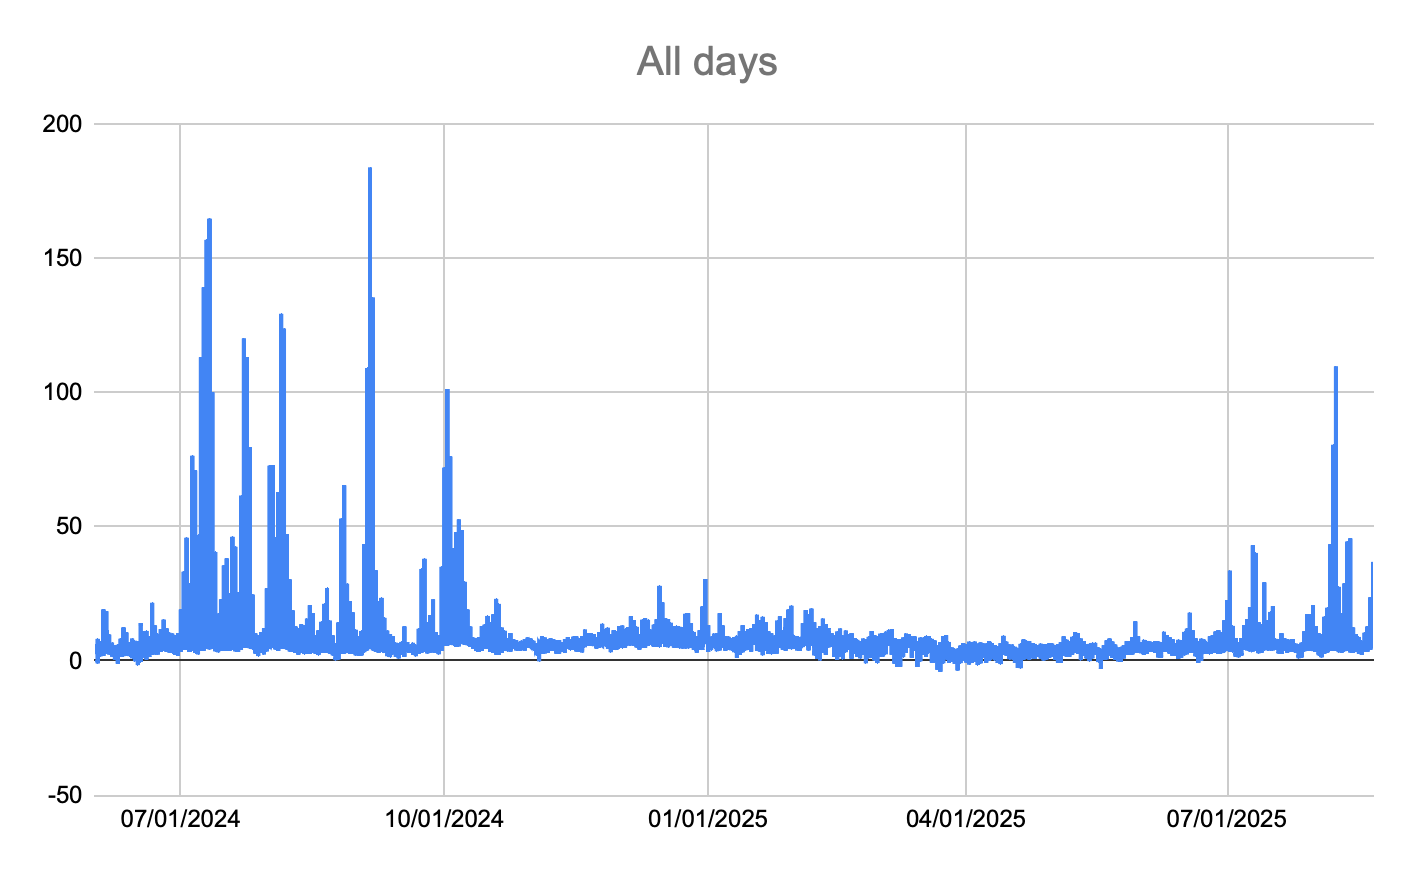
I have collected the rates for my circuit in a Google spreadsheet. Feel free to check it out directly though I may evolve it in the future. The graph below is from the spreadsheet. Value is in cents/kWh.
Average Day
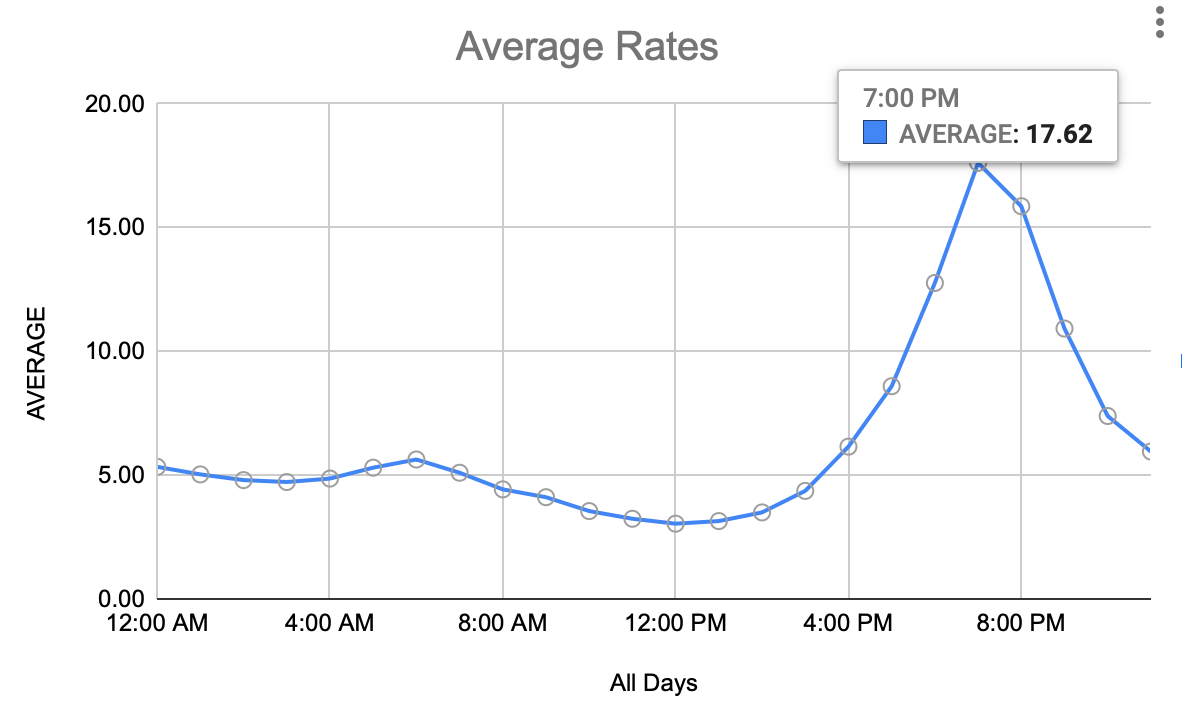
On an average day the rates start at $0.05/kWh from midnight until 8am. At that time the rates are lowered to around $0.03/kWh as cheap renewable energy enters the grid. In the late afternoon the rates start rising until they reach $0.17/kWh at 7pm before tapering off.
The PG&E’s Time Of Use rates do not fully follow this pattern. Although they have an Off Peak period between midnight at 8am, there is no Super Off Peak unlike other some other utilities. The TOU rates are also substantially higher - arguably because they include the fixed costs mentioned above. And the ratio between Peak and Off Peak on PG&E’s TOU is just a factor of 2, while here it is almost 6.
Highest Rates
The day with the highest rate since June 2024 was Sep 6th, 2024. The rate reached $1.83/kWh.
Highest Rate in 2025
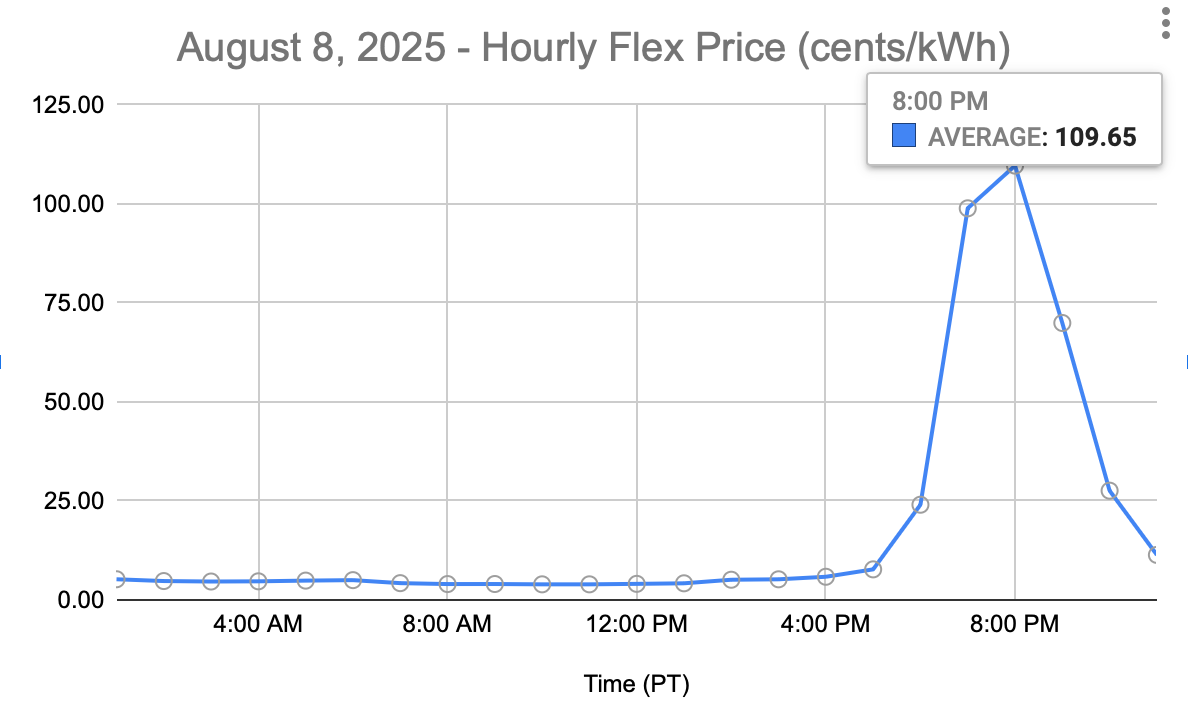
The highest rate in 2025 was on August 8, 2025. The peak was $1.09/kWh.
How Often Are Rates High?
A battery can be used to avoid importing when the rates are high. The size of the battery needed will depend on how much power the house uses and how long the high rates last.
Let’s start by looking at the frequency and the duration of the rate peaks.
There are only 21 hours with rates above $1.00/kWh since June 2024; 20 of those hours were in 2024, but just 1 hour so far in 2025 ($1.09 on August 8, at 8 pm). There are 70 hours with rates above $0.50, 61 of them in 2024 and, so far, only 9 of them in 2025.
I found 3 days in 2024 that had 4 consecutive hours with a rate over $0.50, on August 9, 10 and 11. In contrast, so far, we have had just one day in 2025, on August 5th.
Initial Analysis
The Grid in 2025 is Better than in 2024
California has had a fairly mild summer but the numbers above suggest a CAISO grid that has been improving from 2023 through 2024 and into 2025.
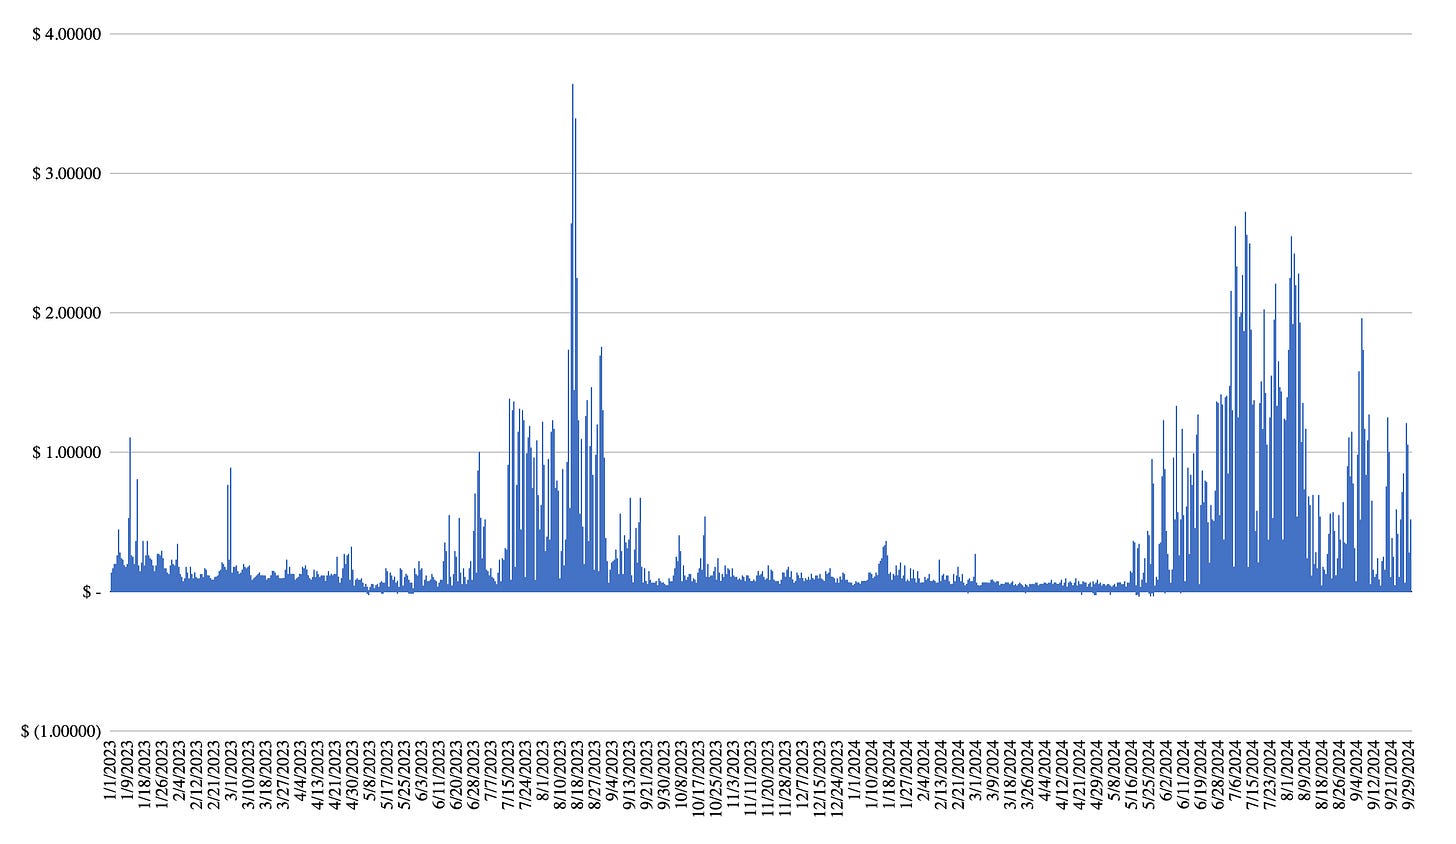
An additional indicator comes from looking at the sample data provided by PG&E regarding rates between January 2023 and September 2024 - unfortunately it has not been updated since then. The original XSLX file is here; I uploaded it into a Google spreadsheet here and used it to create a simple graph, shown below:
The big spike is on the 16th of August of 2023, when rates reached over $3.64. The peaks shown in the summer of 2024 are lower and are consistent with my own data, discussed previously.
Time Shifting
Based on the above data, a reasonable approach to leverage dynamic rates is to use a moderately sized modern residential battery that will do time-shifting for the whole household. The time shifting decisions can be done by the battery automatically using the data provided by the CEC MIDAS server - this is akin to the TOU mode already present in some battery systems.
From an overall bill’s perspective, the goal needs NOT be to avoid any imports when the rates are high but just reduce imports when the rates are highest to take advantage of the much lower rates in other time periods. In most days we are talking about 1-3 hours. In the very worse case, 4 hours.
Maximum Load
Our household’s largest load is the EVSE. Time-shifting EV charging is easy; we used to charge that at night; we now try to reduce GHG emissions and charge during the day whenever possible. Setting that aside, the max load in the house is 4 kW, from our HP HVAC.
We live in a temperate climate zone and our house is well insulated, so we don’t need to cool the house very often but even if we did, a small 8 kWh battery would allow for very aggressive managing of daily electric costs.
Summary
The data provided from the PG&E Hourly Flex Pilot shows Dynamic Rates with enough variation between low and high values (factor of 6 in average) to yield benefits from customer-side load management. The rate spikes are fairly narrow (1-3 hours) and moderate (maxed at $1 in 2025). This suggests a simple approach to load management through a modern residential battery system that charges and discharges a moderately sized battery (8kWh) using the price signal provided by CEC’s MIDAS. A battery system also provides additional benefits.
The data also suggests an improving CAISO grid, which would have implications for tariffs designed around Dynamic Rates - a simple and easy to understand tariff may be better than more complex tariffs designed for a weaker grid.
A full ROI discussion of Dynamic Rates relies on the actual tariff build around them. I hope to cover this area, including the CalFUSE subscription tariff, and the forthcoming Base Services Charge, in a future post.





Carrier announced a pilot project with an HVAC that includes a battery. Next week is Climate Week NYC; perhaps they will provide more details then. An appliance like this can adjust its consumption based on a price signal, like a Copper Stove.
https://www.corporate.carrier.com/news/news-articles/202509_carrier-powering-future-energy.html
The Aug 28th CPUC voting meeting actually included the Proposed Decision (PD) on Guidance for Utility Dynamic Hourly Rates. PR is at https://docs.cpuc.ca.gov/PublishedDocs/Published/G000/M578/K060/578060595.PDF
There were many comments from stakeholders and intervenors after the PD; I skimmed through them but I have not had time to really look into them. I fully expected the Commission NOT to take the topic at its earliest opportunity (the 28th) but they did.
I will try to go through the PD to form an opinion on it. I remain positive about Dynamic Rates but the details matter.